This article will install the Prometheus server in different ways, including installation from the binary package, installation via Docker, and install Prometheus in Kubernetes. It will also explain the core configuration of the Prometheus server to facilitate debugging services tailored to different scenarios. Below is the detailed installation guide.
¶ Step-by-step Installation
¶ Install Prometheus Using Pre-compiled binaries
Generally, we use the latest LTS version to ensure service stability. If you want to experience some new features, you can choose the latest version. In this article, we will use LTS v2.53.4 as an example.
Download the latest release of Prometheus for your platform, then extract it and move the prometheus dir to /usr/local/.
# Download the Pre-compiled binaries tarball
$ wget https://github.com/prometheus/prometheus/releases/download/v2.53.4/prometheus-2.53.4.linux-amd64.tar.gz

# Extract the tarball
$ tar zxvf prometheus-2.53.4.linux-amd64.tar.gz

# Move prometheus dir to /usr/local/
$ sudo mv prometheus-2.53.4.linux-amd64 /usr/local/prometheus
Before running the Prometheus server, it need to prepare the config file for Prometheus server. For me, I prefer to save the config file to /data/etc/${SERVICE_NAME}/, and save the data to /data/data/${SERVICE_NAME}. There are 3 core config file env.yml, prometheus.yml and web.yml like below.
- env.yml: centralizes environment‑specific variables, setup the env var in config file is more easy to manage.
- prometheus.yml: the main Prometheus configuration file, defining global settings, scrape jobs, alerting rules, and retention policies.
- web.yml: secures the Prometheus web UI by configuring TLS certificates, basic auth, and related settings.
tls_server_config:
http_server_config:
basic_auth_users:
  cerek: "$2y$05$sh1tdsIRiHoCF/IA.azuS.XCtbjdKyQfbnPva6mEN2XcVCAbNuceu"
# Set the command-line arguments to pass to the server.
# Due to shell escaping, to pass backslashes for regexes, you need to double
# them (\\d for \d). If running under systemd, you need to double them again
# (\\\\d to mean \d), and escape newlines too.
ARGS="
--storage.tsdb.path=/data/prometheus \
--storage.tsdb.retention.time=90d \
--storage.tsdb.retention.size=0 \
--web.console.libraries=/usr/local/prometheus/console_libraries \
--web.console.templates=/usr/local/prometheus/consoles \
--web.listen-address=0.0.0.0:9090 \
--web.enable-lifecycle \
--web.enable-remote-write-receiver \
--web.external-url= \
--enable-feature=native-histograms \
--web.config.file=/data/etc/prometheus/web.yml \
--config.file=/data/etc/prometheus/prometheus.yml \
--web.enable-admin-api"

# prometheus supports the following options:
#
#  --alertmanager.notification-queue-capacity=10000
#    The capacity of the queue for pending Alertmanager notifications.
#  --config.file="/etc/prometheus/prometheus.yml"
#    Prometheus configuration file path.
#  --enable-feature=<feature,...>
#    Comma separated feature names to enable. Valid options:
#    exemplar-storage, expand-external-labels, memory-snapshot-on-shutdown,
#    promql-at-modifier, promql-negative-offset, remote-write-receiver,
#    extra-scrape-metrics, new-service-discovery-manager. See
#    https://prometheus.io/docs/prometheus/latest/feature_flags/ for more
#    details.
#  --log.format=logfmt
#    Output format of log messages. One of: [logfmt, json].
#  --log.level=info
#    Only log messages with the given severity or above. One of: [debug, info,
#    warn, error].
#  --query.lookback-delta=5m
#    The maximum lookback duration for retrieving metrics during expression
#    evaluations and federation.
#  --query.max-concurrency=20
#    Maximum number of queries executed concurrently.
#  --query.max-samples=50000000
#    Maximum number of samples a single query can load into memory. Note that
#    queries will fail if they try to load more samples than this into memory,
#    so this also limits the number of samples a query can return.
#  --query.timeout=2m
#    Maximum time a query may take before being aborted.
#  --rules.alert.for-grace-period=10m
#    Minimum duration between alert and restored "for" state. This is
#    maintained only for alerts with configured "for" time greater than grace
#    period.
#  --rules.alert.for-outage-tolerance=1h
#    Max time to tolerate prometheus outage for restoring "for" state of alert.
#  --rules.alert.resend-delay=1m
#    Minimum amount of time to wait before resending an alert to Alertmanager.
#  --storage.remote.flush-deadline=<duration>
#    How long to wait flushing sample on shutdown or config reload.
#  --storage.remote.read-concurrent-limit=10
#    Maximum number of concurrent remote read calls. 0 means no limit.
#  --storage.remote.read-max-bytes-in-frame=1048576
#    Maximum number of bytes in a single frame for streaming remote read
#    response types before marshalling. Note that client might have limit on
#    frame size as well. 1MB as recommended by protobuf by default.
#  --storage.remote.read-sample-limit=5e7
#    Maximum overall number of samples to return via the remote read interface,
#    in a single query. 0 means no limit. This limit is ignored for streamed
#    response types.
#  --storage.tsdb.allow-overlapping-blocks
#    Allow overlapping blocks, which in turn enables vertical compaction and
#    vertical query merge.
#  --storage.tsdb.path="/var/lib/prometheus/metrics2/"
#    Base path for metrics storage.
#  --storage.tsdb.retention.size=STORAGE.TSDB.RETENTION.SIZE
#    Maximum number of bytes that can be stored for blocks. A unit is required,
#    supported units: B, KB, MB, GB, TB, PB, EB. Ex: "512MB".
#  --storage.tsdb.retention.time=STORAGE.TSDB.RETENTION.TIME
#    How long to retain samples in storage. When this flag is set it overrides
#    "storage.tsdb.retention". If neither this flag nor
#    "storage.tsdb.retention" nor "storage.tsdb.retention.size" is set, the
#    retention time defaults to 15d. Units Supported: y, w, d, h, m, s, ms.
#  --storage.tsdb.retention=STORAGE.TSDB.RETENTION
#    [DEPRECATED] How long to retain samples in storage. This flag has been
#    deprecated, use "storage.tsdb.retention.time" instead.
#  --storage.tsdb.use-lockfile
#    Create a lockfile in data directory.
#  --web.config.file=""
#    [EXPERIMENTAL] Path to configuration file that can enable TLS or
#    authentication.
#  --web.console.libraries="/etc/prometheus/console_libraries"
#    Path to the console library directory.
#  --web.console.templates="/etc/prometheus/consoles"
#    Path to the console template directory, available at /consoles.
#  --web.cors.origin=".*"
#    Regex for CORS origin. It is fully anchored. Example:
#    'https?://(domain1|domain2)\.com'.
#  --web.enable-admin-api
#    Enable API endpoints for admin control actions.
#  --web.enable-lifecycle
#    Enable shutdown and reload via HTTP request.
#  --web.external-url=<URL>
#    The URL under which Prometheus is externally reachable (for example, if
#    Prometheus is served via a reverse proxy). Used for generating relative
#    and absolute links back to Prometheus itself. If the URL has a path
#    portion, it will be used to prefix all HTTP endpoints served by
#    Prometheus. If omitted, relevant URL components will be derived
#    automatically.
#  --web.listen-address="0.0.0.0:9090"
#    Address to listen on for UI, API, and telemetry.
#  --web.local-assets="/usr/share/prometheus/web/"
#    Path to static asset/templates directory.
#  --web.max-connections=512
#    Maximum number of simultaneous connections.
#  --web.page-title="Prometheus Time Series Collection and Processing Server"
#    Document title of Prometheus instance.
#  --web.read-timeout=5m
#    Maximum duration before timing out read of the request, and closing idle
#    connections.
#  --web.route-prefix=<path>
#    Prefix for the internal routes of web endpoints. Defaults to path of
#    --web.external-url.
#  --web.user-assets=<path>
#    Path to user asset directory, available at /user.
# my global config
global:
  scrape_interval: 15s # Set the scrape interval to every 15 seconds. Default is every 1 minute.
  evaluation_interval: 15s # Evaluate rules every 15 seconds. The default is every 1 minute.
  query_log_file: /data/logs/prometheus/query.log
  # scrape_timeout is set to the global default (10s).

# Alertmanager configuration
alerting:
  alertmanagers:
    - static_configs:
        - targets:
          # - alertmanager:9093

# Load rules once and periodically evaluate them according to the global 'evaluation_interval'.
rule_files:
  # - "first_rules.yml"
  # - "second_rules.yml"

# A scrape configuration containing exactly one endpoint to scrape:
# Here it's Prometheus itself.
scrape_configs:
  # The job name is added as a label `job=<job_name>` to any timeseries scraped from this config.
  - job_name: "prometheus"

    # metrics_path defaults to '/metrics'
    # scheme defaults to 'http'.

    static_configs:
      - targets: ["localhost:9090"]
    basic_auth:
      username: 'cerek'
      password: '123123'
Using systemd to manage the Prometheus is a graceful way. Create the systemd unit file for prometheus and save it to /lib/systemd/system/prometheus.service. The content like below.
$ cat /lib/systemd/system/prometheus.service
[Unit]
Description=Monitoring system and time series database
Documentation=https://prometheus.io/docs/introduction/overview/ man:prometheus(1)
After=time-sync.target

[Service]
Restart=on-failure
User=cerek
EnvironmentFile=/data/etc/prometheus/env.yml
ExecStart=/usr/local/prometheus/prometheus $ARGS
ExecReload=/bin/kill -HUP $MAINPID
TimeoutStopSec=20s
SendSIGKILL=no

# systemd hardening-options
AmbientCapabilities=
CapabilityBoundingSet=
DeviceAllow=/dev/null rw
DevicePolicy=strict
LimitMEMLOCK=0
LimitNOFILE=8192
LockPersonality=true
MemoryDenyWriteExecute=true
NoNewPrivileges=true
PrivateDevices=true
PrivateTmp=true
PrivateUsers=true
ProtectControlGroups=true
ProtectHome=true
ProtectKernelModules=true
ProtectKernelTunables=true
ProtectSystem=full
RemoveIPC=true
RestrictNamespaces=true
RestrictRealtime=true
SystemCallArchitectures=native

[Install]
WantedBy=multi-user.target

# Reload systemd-daemon
$ sudo systemctl systemctl daemon-reload

# Enable and start prometheus server
$ sudo systemctl enable prometheus.service
$ sudo systemctl start prometheus.service
$ sudo systemctl status prometheus.service
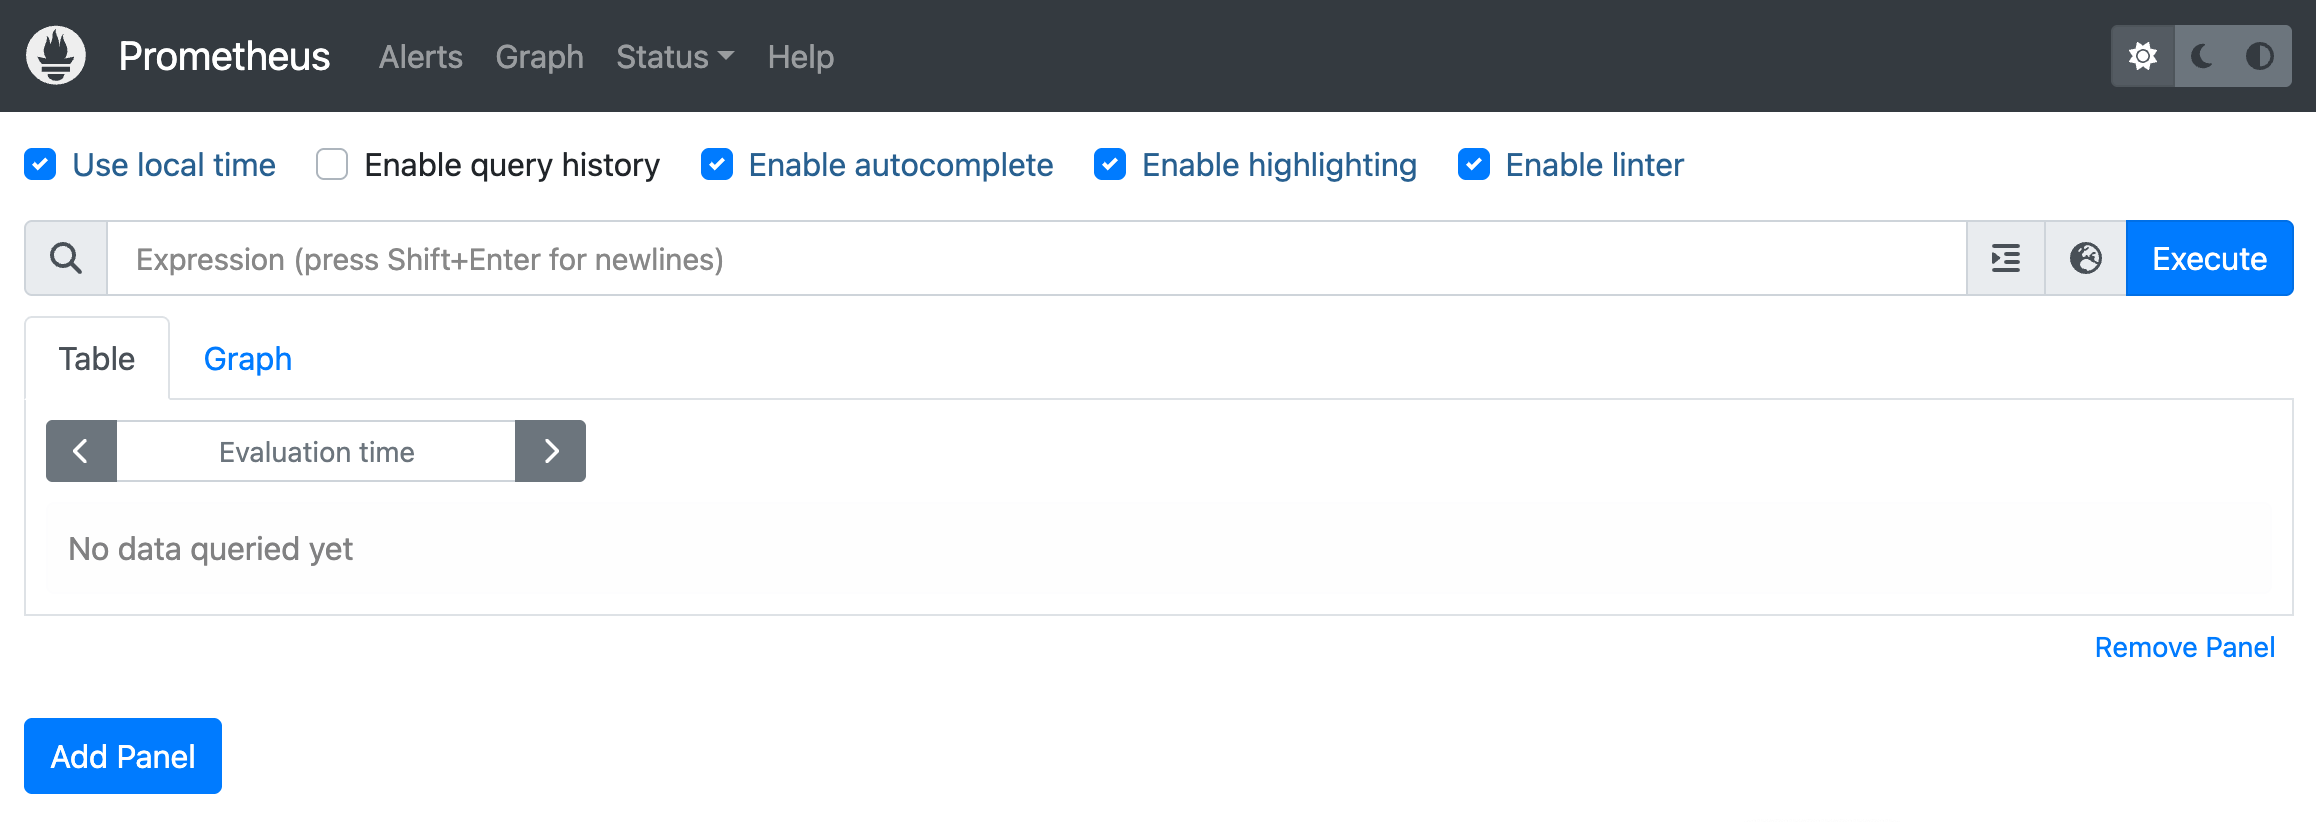
Access Prometheus server via http://localhost:9090/
¶ Install Prometheus via Docker
Using docker to launch the prometheus server is quite easy with the docker run command. By default, it will use the default config file, so we need to prepare the Volume for mapping our own configuration to the container.
# Create the dir to save the config file and data
$ sudo mkdir -pv /data/etc/prometheus /data/data/prometheus

# Create the config file env.yml, prometheus.yml and web.yml
# Using the same config content in Binary section
# Change the --config.file to /etc/prometheus.yml
# Change the --web.config.file to /etc/web.yml

# Start the prometheus container
$ docker run --name prometheus-server -d -p 9090:9090 -v /data/etc/prometheus:/etc/prometheus -v /data/data/prometheus:/data/prometheus prom/prometheus:v2.53.4
Access Prometheus server via http://localhost:9090/
¶ Install Prometheus in Kubernetes
Coming soon......